Technical analysis is a method of evaluating securities by analyzing statistics generated by market activity, such as past prices and volume. This method can be applied to any type of asset, including cryptocurrency. In this guide, we will explore the basics of technical analysis and how it can be used to make trading decisions in the cryptocurrency market.
The basics of technical analysis
Technical analysis is all about understanding market sentiment by studying charts and indicators. It’s important to understand that past market data can provide insight into the current market conditions. A great way to learn the basics of technical analysis is by visiting tradecrypto.com, which offers a wide range of resources and tutorials for beginners.
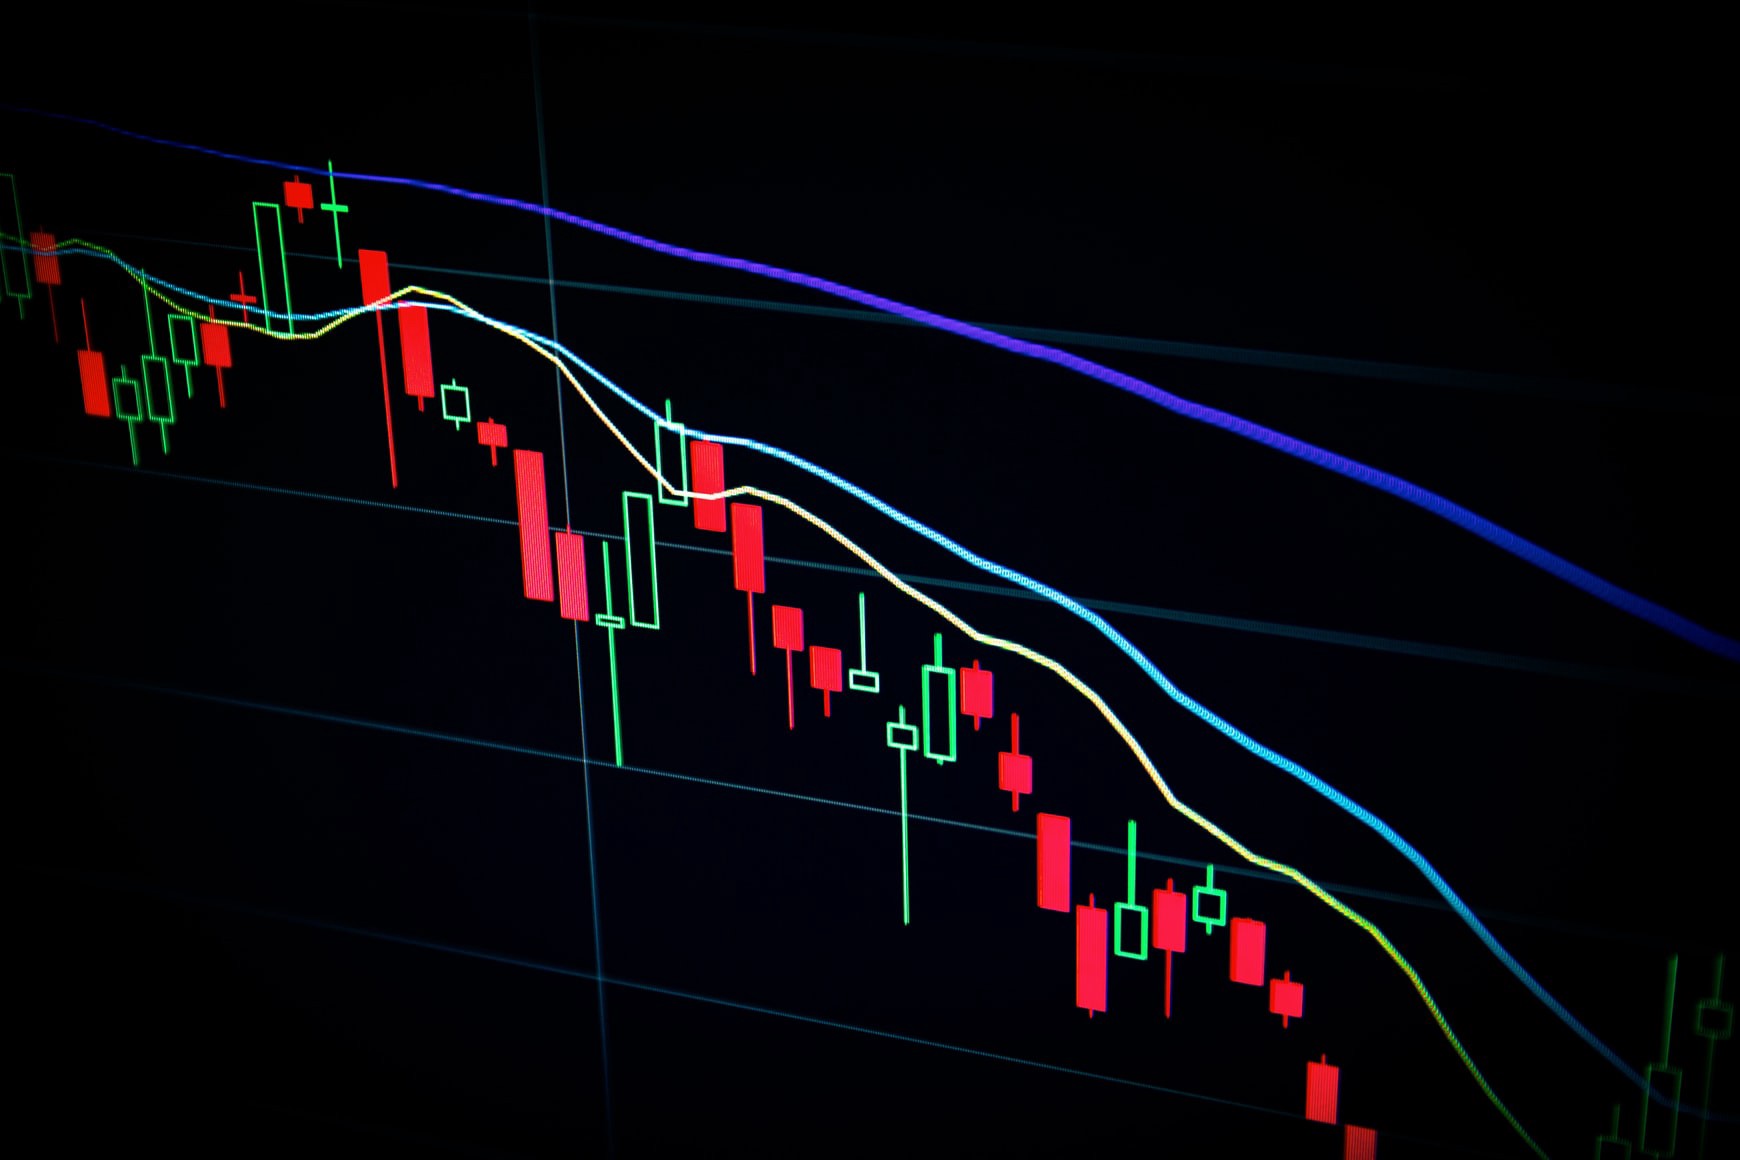
One of the key concepts in technical analysis is the use of charts. Charts provide a visual representation of the market’s performance over a specific period of time. There are several types of charts, including line charts, bar charts, and cand stick charts. Each chart type has its own advantages and disadvantages, and they can be used to identify different types of market trends.
Popular technical indicators
Technical indicators are mathematical calculations that are based on the price and/or volume of an asset. These indicators can be used to identify trends, momentum, and potential reversal points. Some of the most popular indicators used in technical analysis include moving averages, relative strength index (RSI), and moving average convergence divergence (MACD).
Chart Patterns
Another important aspect of technical analysis is the identification of chart patterns. Chart patterns are formed by the market’s price movements and can provide insight into the market’s sentiment. Some of the most common chart patterns include head and shoulders, support and resistance, and triangle patterns.
To identify and interpret chart patterns, it is important to use a trading bot that can analyze the charts for you and detect these patterns in real-time. One such bot is Trality Bot, that has been reviewed by many users and has proven to be effective. You can check out the Trality bot review to find out more about how it can help you in identifying chart patterns.
Risk management and position sizing
In any type of trading, risk management is crucial to success. In technical analysis, risk management can be achieved by setting stop-loss and take-profit levels, and by using proper position sizing. This means determining the size of your trades based on your account balance and risk tolerance.
Conclusion
Technical analysis is a powerful tool for making trading decisions in the cryptocurrency market. By understanding the basics of technical analysis, using popular indicators, identifying chart patterns and managing risk, traders can improve their chances of success. Remember to practice and develop your skills, and to use resources such as tradecrypto.com and trality bot review to help you along the way.